
Tide Level Chart
Tide tables give the times and heights of high and low water, but you often need the level in between — to launch a boat, cross a bar, walk a causeway or fish a rising tide. Enter the high and low water from your official tide table and this chart draws the tide curve, lists the height hour by hour, and tells you when the water will reach the depth you need.
- Free to use
- No sign-up
- Runs in your browser
Tide level chart
| Time | Height | Change in last period |
|---|
Tide Planning Worksheets
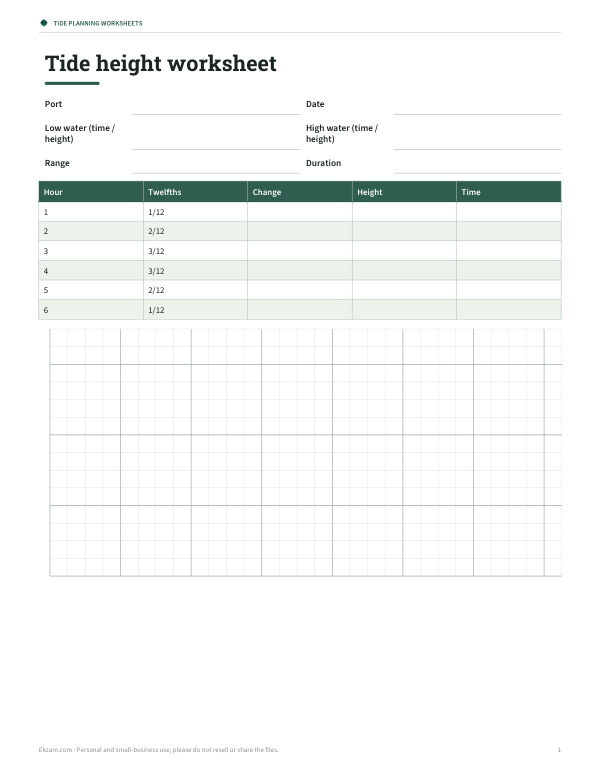
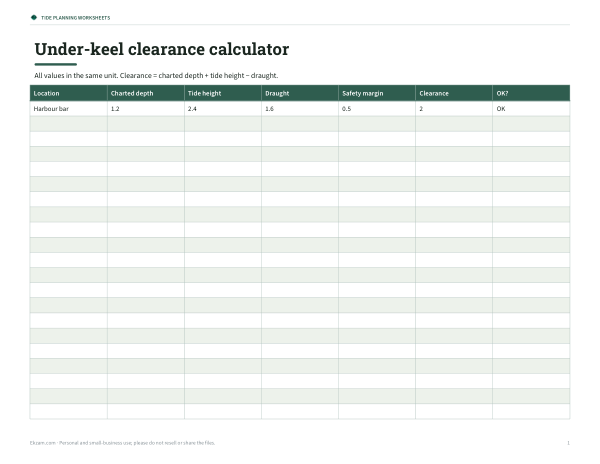
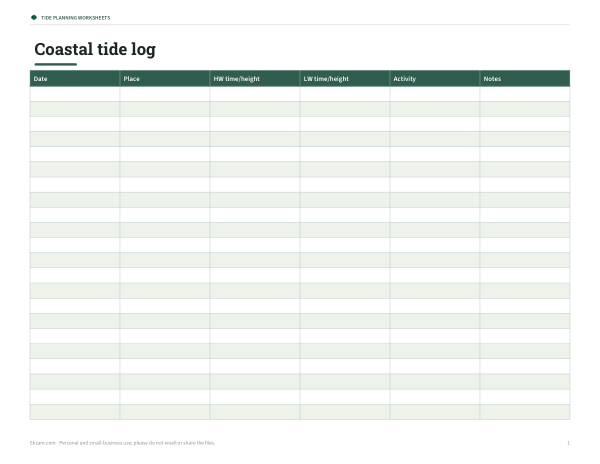
Printable tide height worksheet with rule-of-twelfths table, an under-keel clearance calculator (Excel), a coastal walk and fishing tide log, and a tide terms reference card.
- Tide worksheet (PDF)
- Clearance calculator (XLSX)
- Tide log (PDF, DOCX, XLSX)
- Terms card (PDF)
Formats: PDF, DOCX, XLSX. Instant download after payment (link valid 72 hours, up to 5 downloads). AI-assisted: the templates were drafted with AI help and reviewed and laid out before publishing.
$5.00 USD, one-time 4 files · about $1.25 each
- Instant download
- 7-day refund
- Secure checkout by Stripe
7-day money-back guarantee. Full refund within 7 days of purchase, even after you download.
Free sample: Tide Height Worksheet (PDF, 53 KB)
Full refund within 7 days — see the refund policy and license.
Free printables
Single sheets you can print right now, no sign-up. The full pack adds every sheet in one download plus the editable files.
 Printable Tide Terms Card
Why tides rise and fall
Tides are caused mainly by the Moon’s gravity, with help from the Sun, pulling on the oceans as the Earth rotates. Most coasts have two high and two low waters each day (semi-diurnal tides), about 6 hours 12 minutes apart, so tides happen roughly 50 minutes later each day. Some places have one high and one low a day (diurnal) or two unequal tides (mixed). Around new and full moon, the Sun and Moon line up to produce larger spring tides; around the quarter moons, smaller neap tides.
Reading a tide table
| Column | Meaning |
|---|---|
| Time | Time of high or low water, in local standard or daylight time as noted |
| Height | Height above chart datum — usually the lowest predicted tide level or mean lower low water |
| Range | Difference between successive high and low water |
| Spring / neap | Larger or smaller ranges linked to the Moon’s phase |
Always use the official tide table for the nearest reference port or secondary station, and apply any time and height corrections it lists. Depth of water = charted depth + tide height.
The rule of twelfths
| Hour after low or high water | Change in that hour | Cumulative |
|---|---|---|
| 1st | 1/12 of range | 1/12 |
| 2nd | 2/12 | 3/12 |
| 3rd | 3/12 | 6/12 (half) |
| 4th | 3/12 | 9/12 |
| 5th | 2/12 | 11/12 |
| 6th | 1/12 | 12/12 |
The tide changes slowly near high and low water and fastest in the middle — half the range in the third and fourth hours. The rule of twelfths is a quick mental approximation that assumes six equal hours between high and low water. The cosine method gives a smooth curve closer to a real semi-diurnal tide; both are estimates.
Worked example
Low water is at 06:10 with 0.8 m and high water at 12:25 with 4.6 m, a range of 3.8 m over 6 h 15 min. A boat needs 2.5 m of tide to cross a sandbar. The cosine curve shows the tide reaching 2.5 m shortly after 09:00 — just under halfway through the rise — and the height at 09:00 is about 2.4 m. By the rule of twelfths the timing is similar. The skipper plans to cross after 09:30 for a safety margin.
Clearance under keels and bridges
- Under-keel clearance: depth of water (charted depth + tide height) − boat draught. Keep a safety margin for waves, squat and chart inaccuracies.
- Bridge clearance: charted clearance is usually given above a high-water datum; at lower tides there is more room. Check the datum used on your chart.
- Drying heights: underlined figures on charts show heights above chart datum of areas that dry at low water — they cover when the tide exceeds that height.
Tide and safety on the shore
Walkers, anglers and beachcombers are regularly cut off by the rising tide on sandbanks, causeways and headlands. Check the time of high water before setting out, allow plenty of margin, and turn back early. Remember the tide rises fastest in the middle hours. Onshore winds and low atmospheric pressure can make tides higher than predicted; offshore winds and high pressure can make them lower.
Fishing and tides
Many anglers find fish feed more actively when water is moving, especially during the middle hours of the flood or ebb, when currents stir up food. Slack water around high and low tide can be quieter. Local knowledge matters: some marks fish best on a rising tide, others at low water.
Tidal streams
Tides move water horizontally as well as vertically. Tidal streams (currents) are usually strongest around the middle of the flood and ebb — the same hours when the height changes fastest — and weakest near slack water. In narrow channels and around headlands, streams can be strong enough to stop small boats or swimmers. Use tidal stream atlases or diamonds on charts to plan passages with the stream rather than against it.
Limitations
This chart interpolates between two tide table values you supply; it does not predict tides by itself. Real tides can be asymmetric — rising faster than they fall — in estuaries and shallow areas, and some ports have double high waters or long stands. For navigation where depth is critical, use official tidal curves for your port, local tidal stream atlases and a margin of safety.
Privacy
Calculations run in your browser; nothing is stored or uploaded.
Frequently asked questions
How do I find the tide height between high and low water?
Use the rule of twelfths or a cosine curve between the tide table values — this chart does both.
What is the rule of twelfths?
The tide changes by 1, 2, 3, 3, 2 and 1 twelfths of the range in the six hours between low and high water.
What is chart datum?
The reference level on charts and tide tables, usually near the lowest predicted tide.
Why are tides later each day?
The Moon returns overhead about 50 minutes later each day.
What is the difference between spring and neap tides?
Spring tides have the largest range, near new and full moon; neap tides have the smallest, near the quarter moons.
Why does the tide rise faster in the middle?
The tide follows a roughly sinusoidal curve, so the rate of change is greatest halfway between high and low water.
Can I use this for navigation?
Only as an estimate; use official tidal curves and a safety margin.
Is my data stored?
No, it runs in your browser.